Projects
Data Transformation Pipeline with DBT for Blockchain Analytics
Situation
Needed a scalable, reliable, and cost-effective data transformation pipeline for cross-chain blockchain analytics across Ethereum, Arbitrum, Linea, and Eigenlayer.
Task
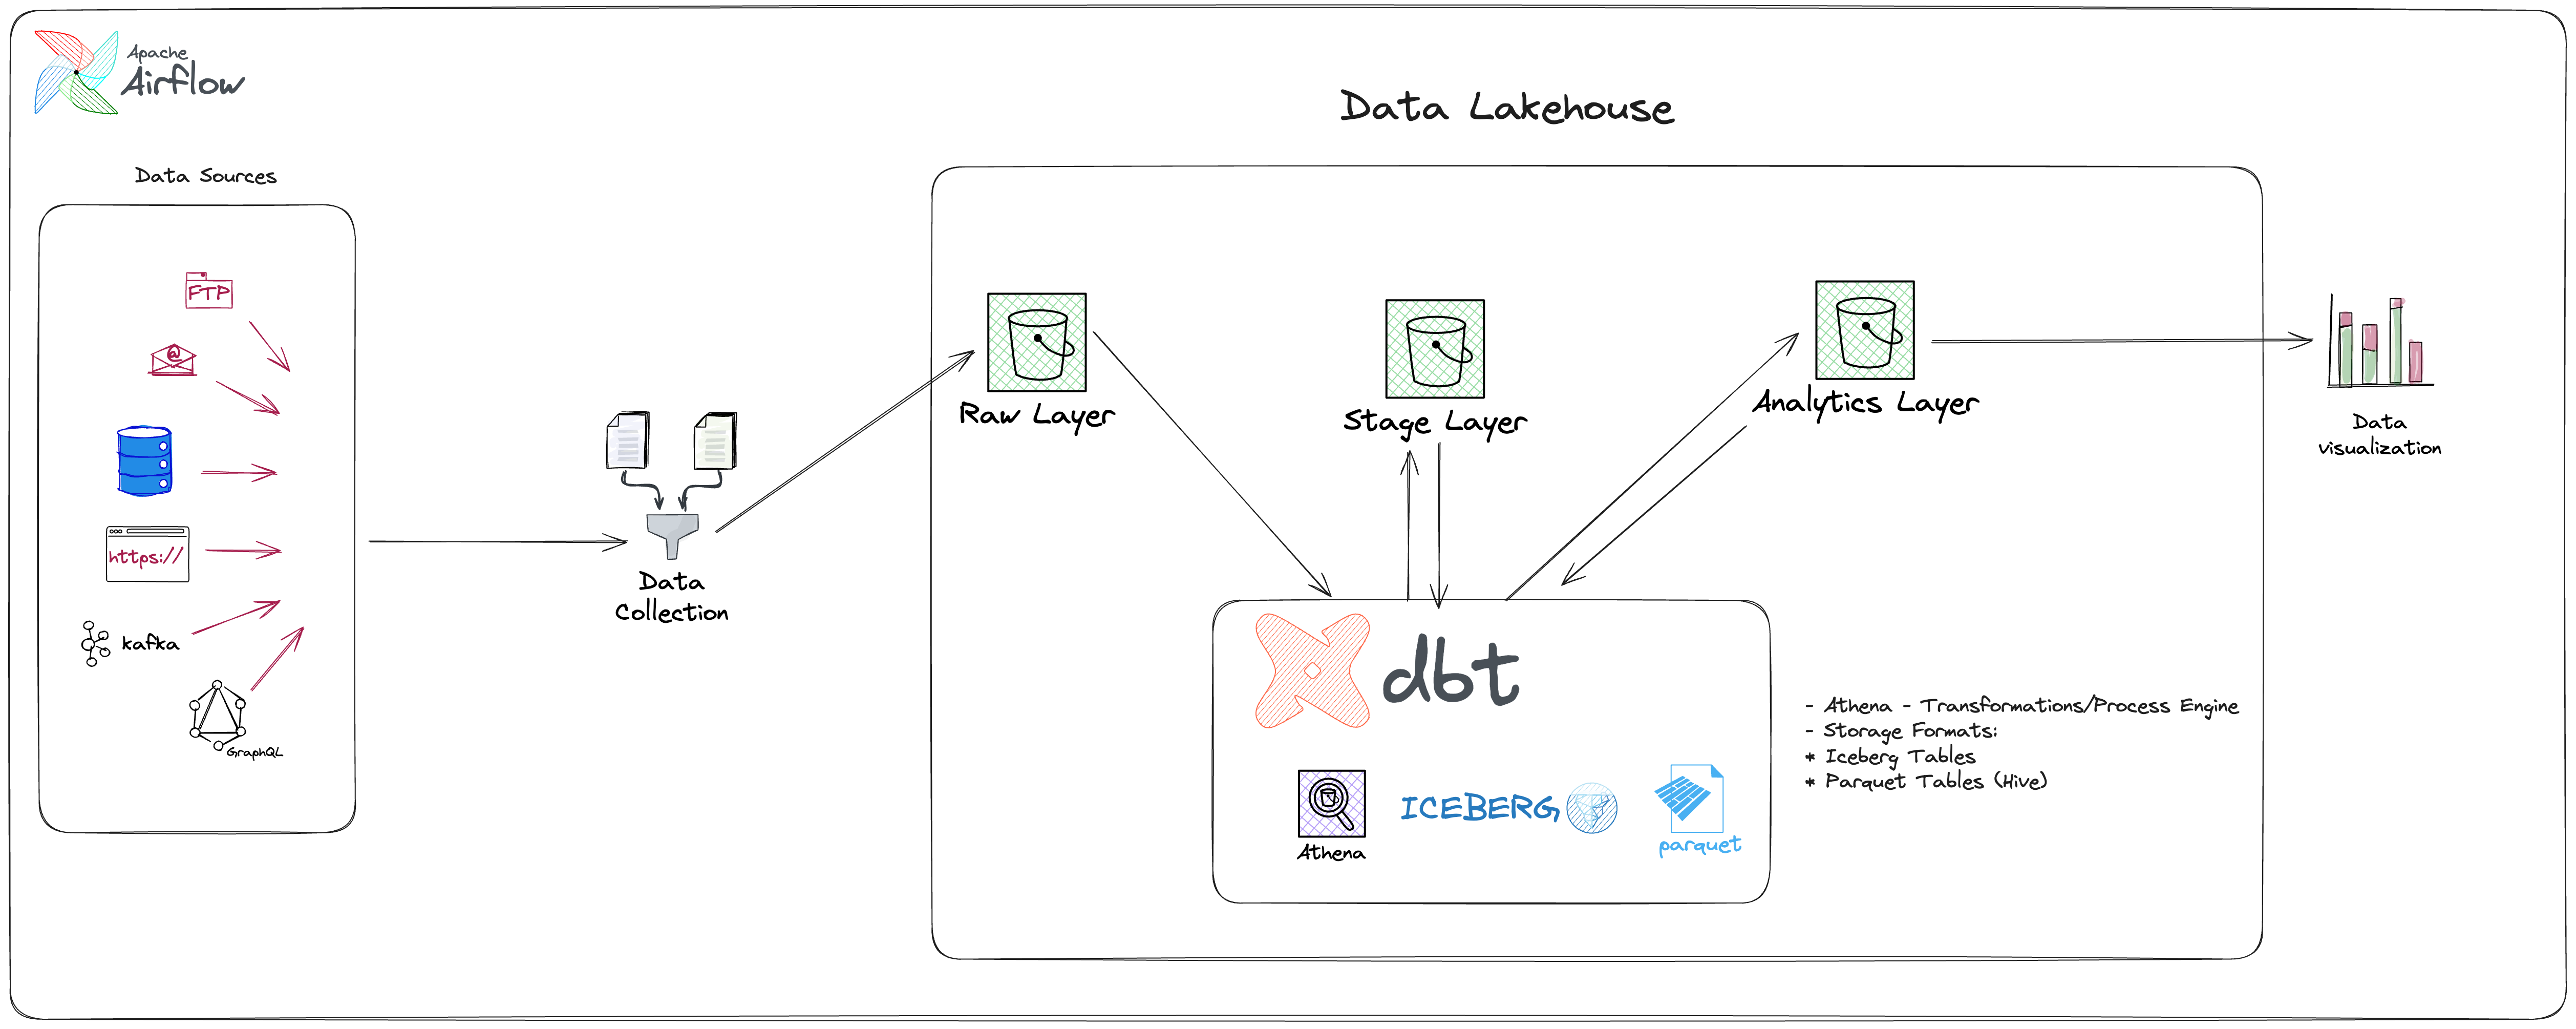
Build a DBT-based transformation pipeline using a 3-layer architecture, integrating with multiple cloud data warehouses and supporting advanced analytics.
Action
- Developed reusable DBT macros and incremental models for efficient data processing
- Automated scheduling and orchestration with Airflow
- Integrated with Athena, Snowflake, and BigQuery for flexible analytics
- Implemented robust testing for data reliability
- Optimized partitioning to reduce processing time and costs
- Standardized models to enable cross-chain analytics
Result
Delivered faster insights, scalable models, improved data reliability, and reduced infrastructure costs for blockchain analytics.
Automated Dune Analytics Data Ingestion Pipeline
Situation
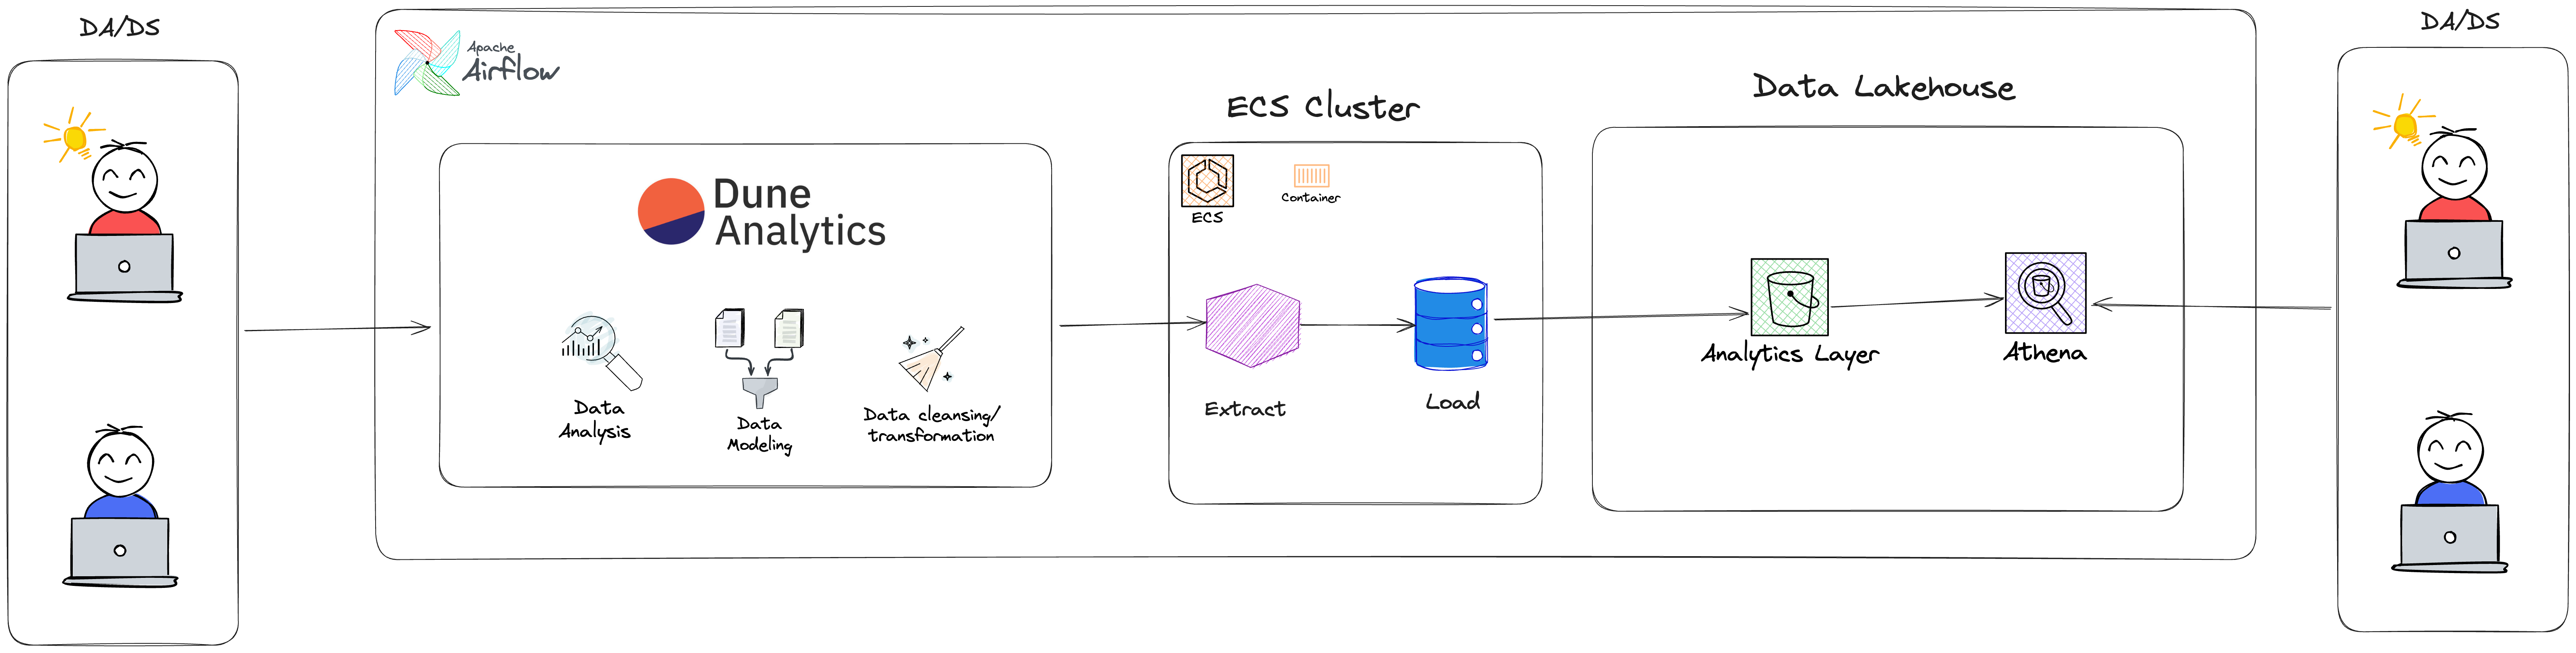
Manual data ingestion from Dune Analytics was slow, error-prone, and limited the team's ability to quickly access blockchain analytics data.
Task
Build an automated pipeline to integrate Dune Analytics with the enterprise data platform, enabling self-service ingestion into Athena.
Action
- Developed a user-friendly interface for self-service data ingestion
- Automated pipeline deployment using ECS, Airflow, Docker, and Terraform
- Integrated Slack notifications for pipeline status updates
- Documented the process for easy onboarding and maintenance
Result
Reduced data ingestion time by 90%, eliminated manual steps, improved data reliability, enhanced team productivity, and reduced operational costs.
Data Pipeline Factory with Automated Deployment
Situation
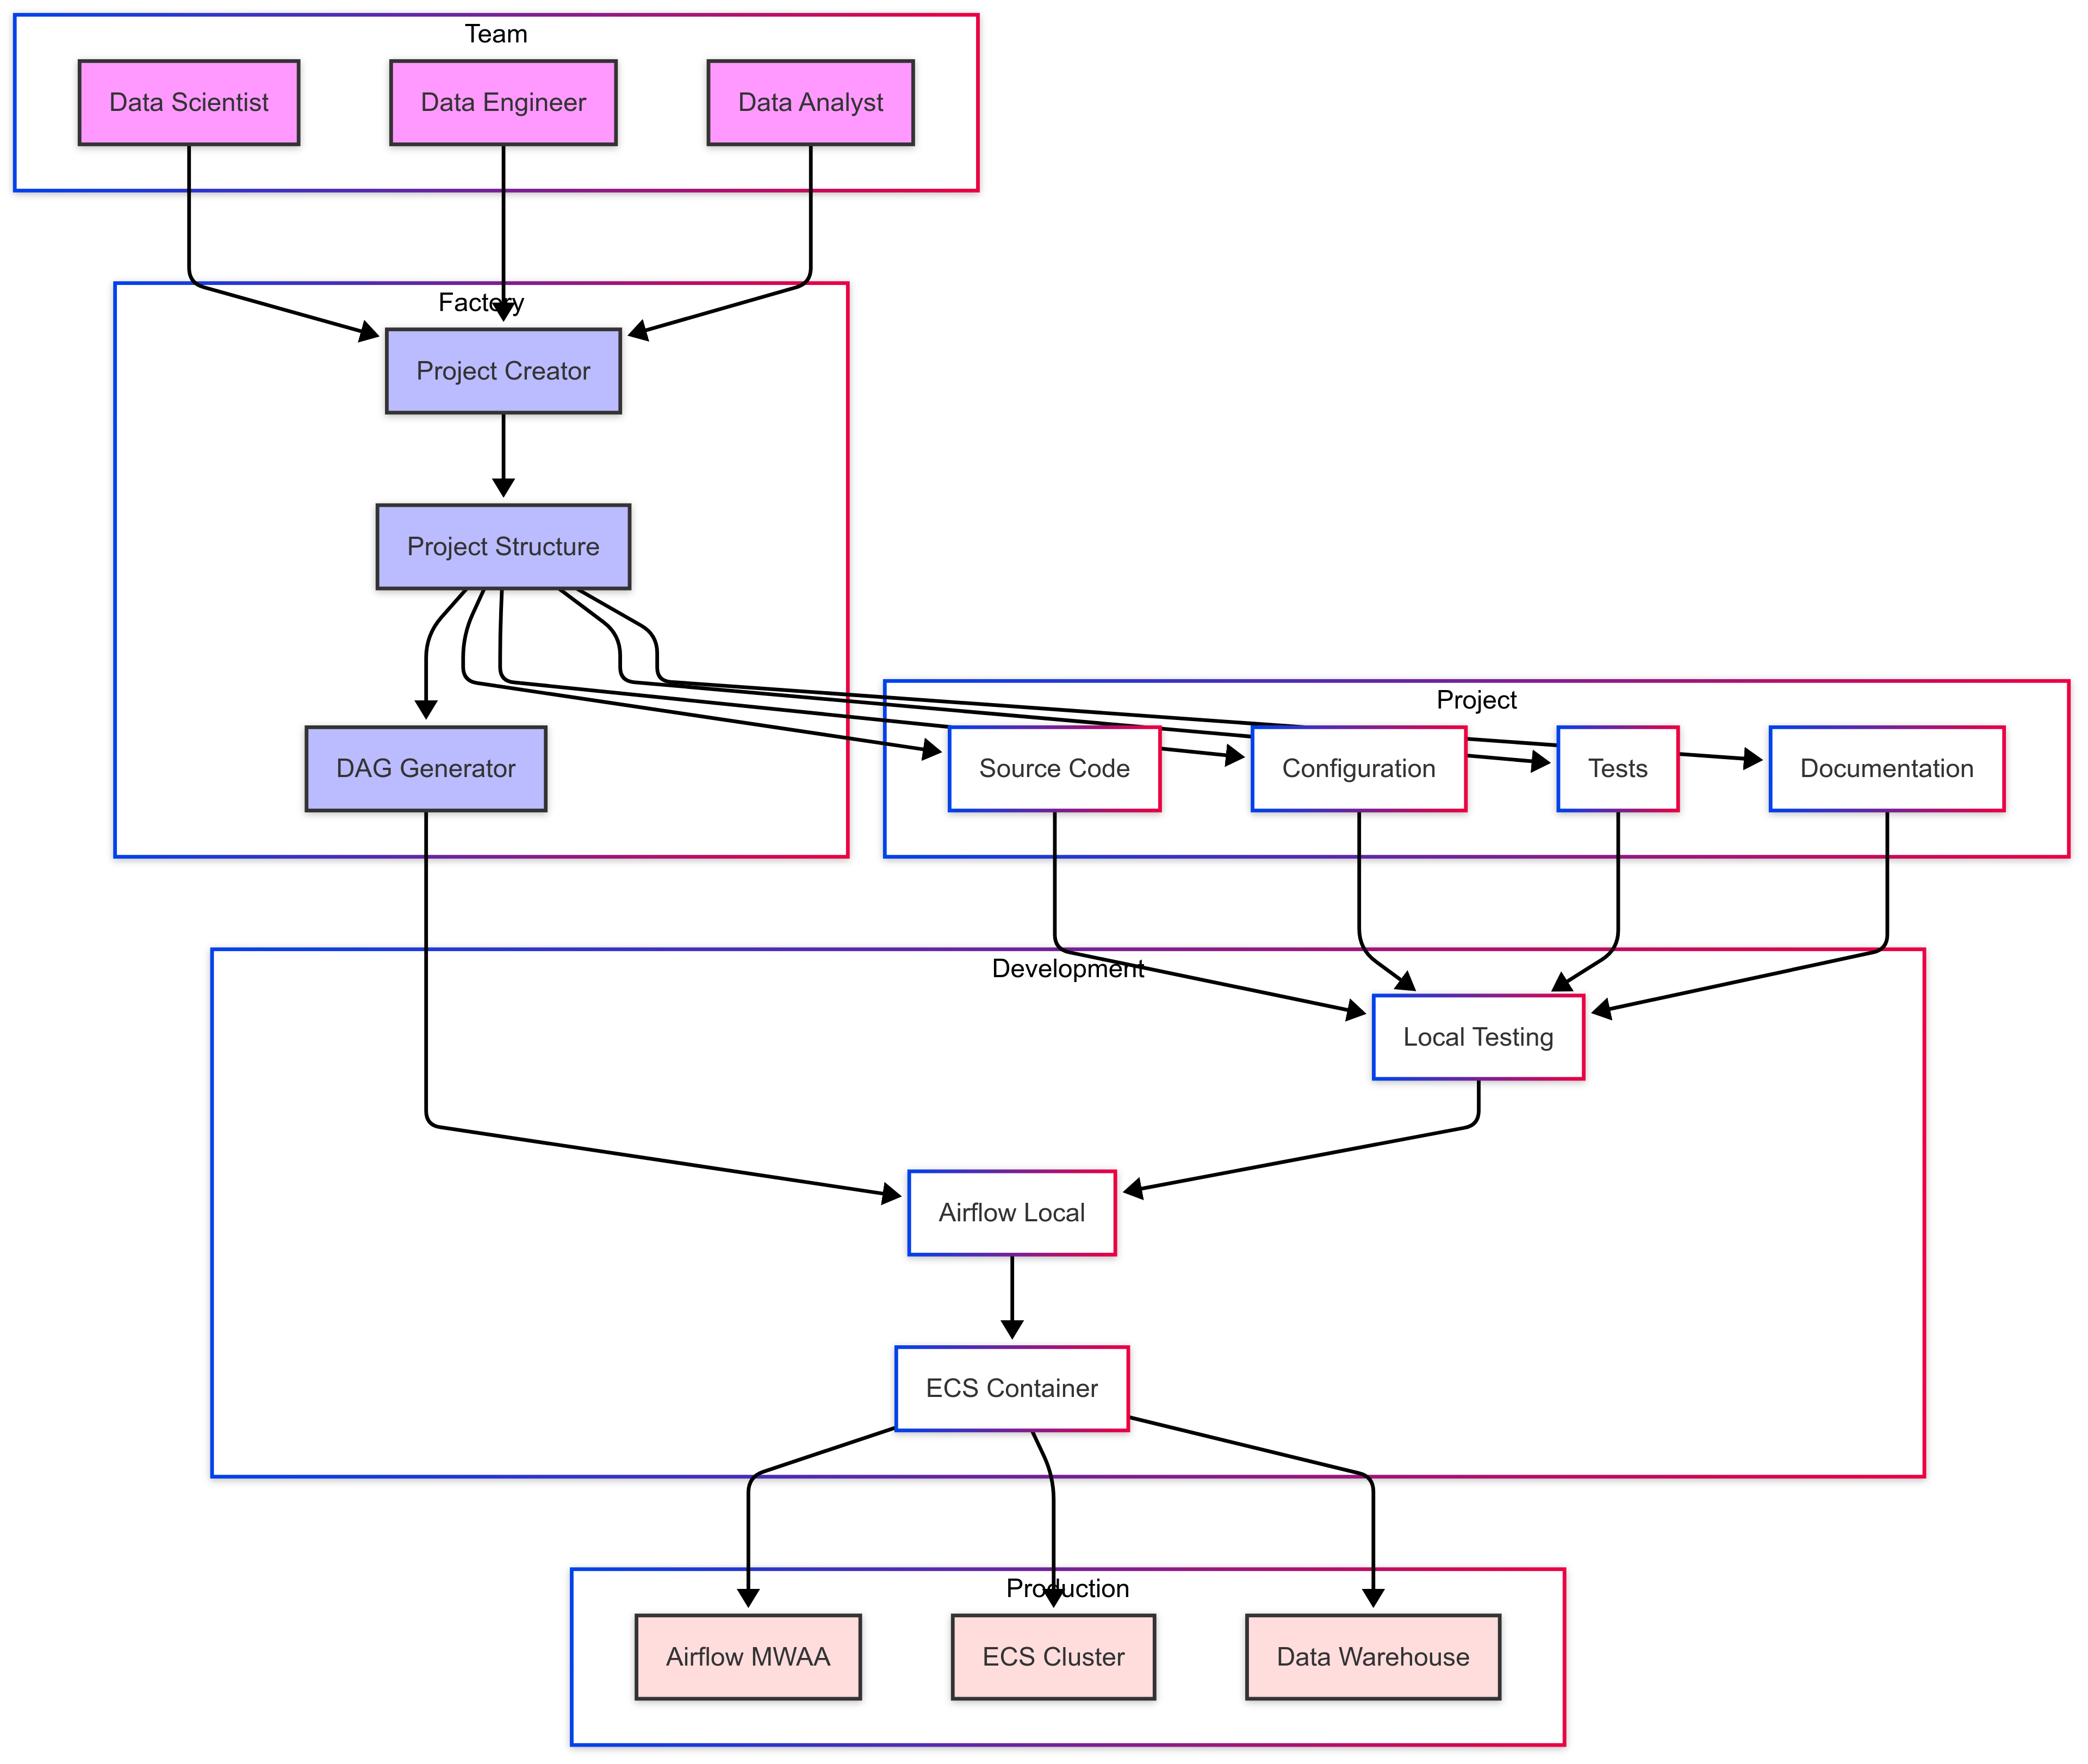
Teams relied on notebooks for prototyping and manual deployment, leading to slow, inconsistent, and unscalable data pipelines.
Task
Build a data pipeline factory to automate project scaffolding, configuration management, and Airflow DAG generation via YAML, enabling seamless dev-to-prod deployment.
Action
- Developed a factory to standardize pipeline structure and automate Airflow DAG creation
- Implemented YAML-driven config management for flexible pipeline definitions
- Automated deployment workflows using Docker, AWS ECS, and CI/CD
- Replaced notebook-based prototypes with production-grade pipelines
- Created onboarding documentation and templates for new team members
Result
Reduced setup time from days to minutes, improved collaboration, automated deployment, enhanced scalability, and cut pipeline deployment from one month to 1-2 weeks.
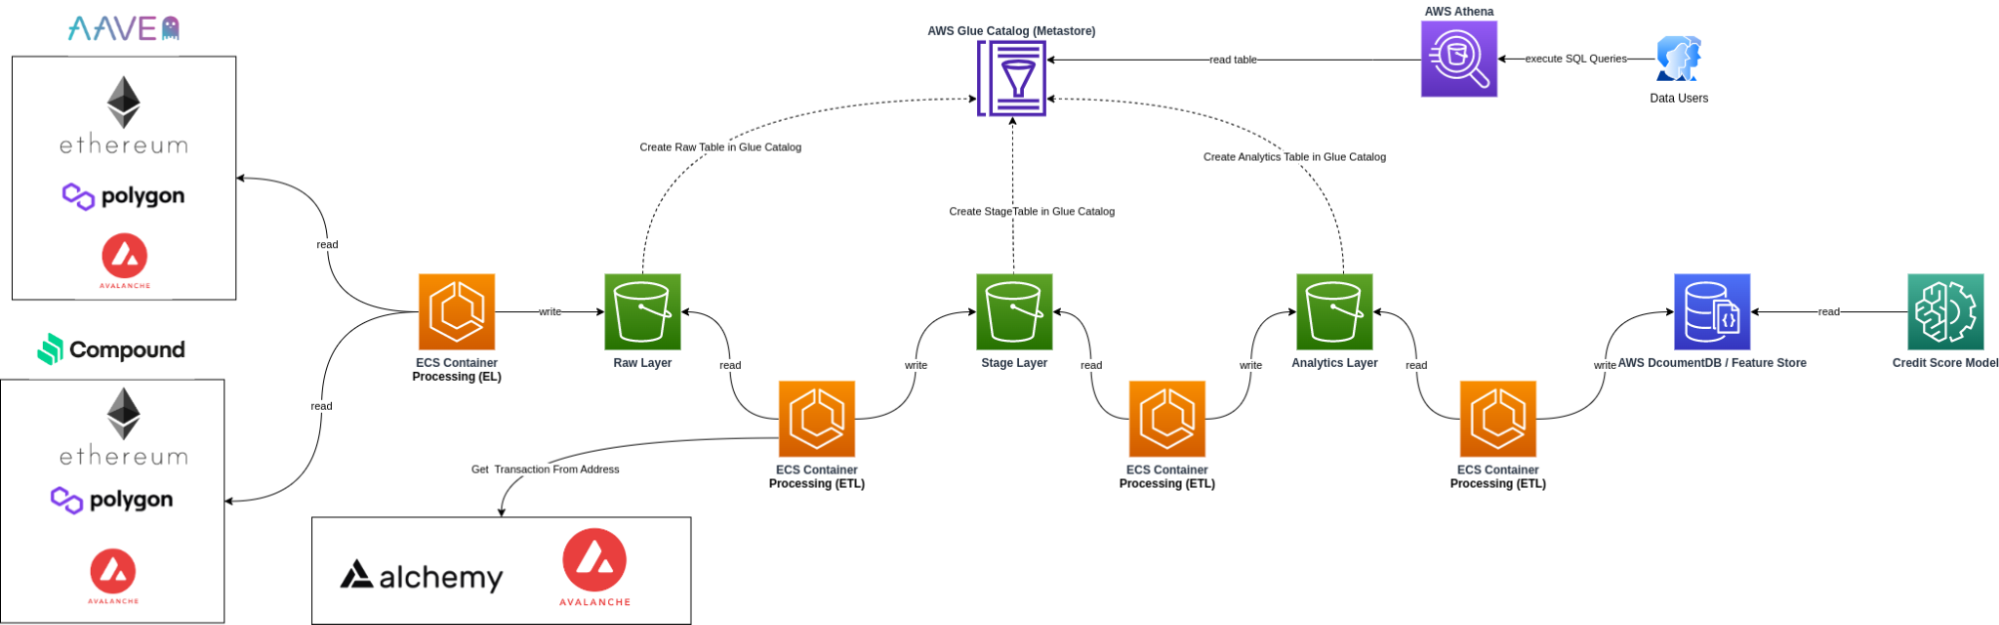
Design and Implement the Data Lakehouse
Situation
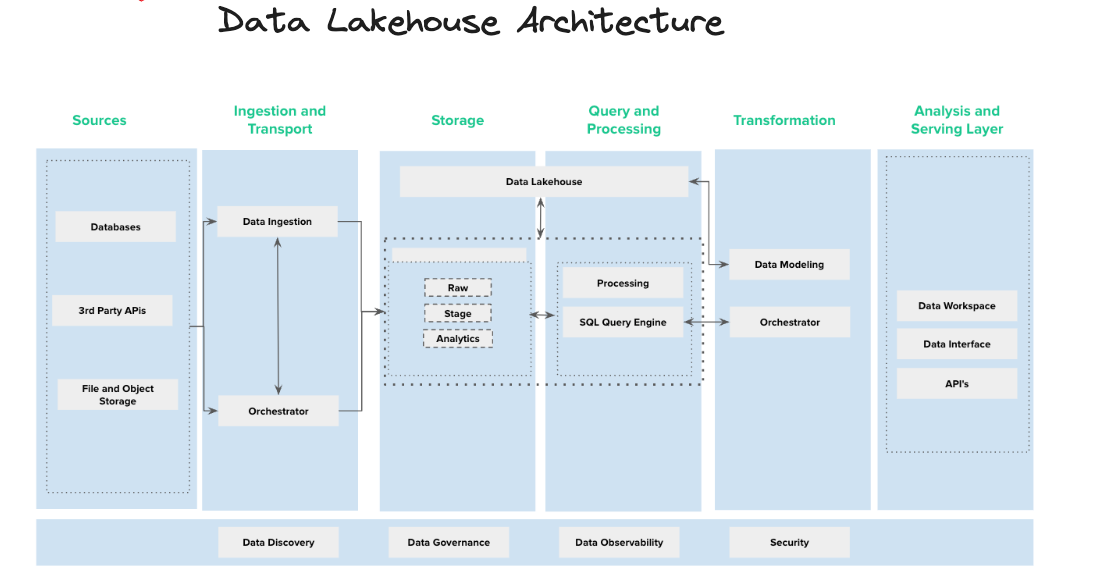
Company needed a robust data platform, moving from a NoSQL database to a comprehensive solution for data-driven culture.
Task
Design and implement a Data Lakehouse Platform to handle multiple data sources including blockchain, lending protocols, and cryptocurrency platforms.
Action
- Conducted POC tests for open table format selection
- Designed scalable architecture for multiple data sources
- Implemented platform with blockchain and DeFi data integration
- Established data access patterns for analytics
Result
Successfully established a functional Data Lakehouse platform enabling data-driven culture and efficient data access for analytics.
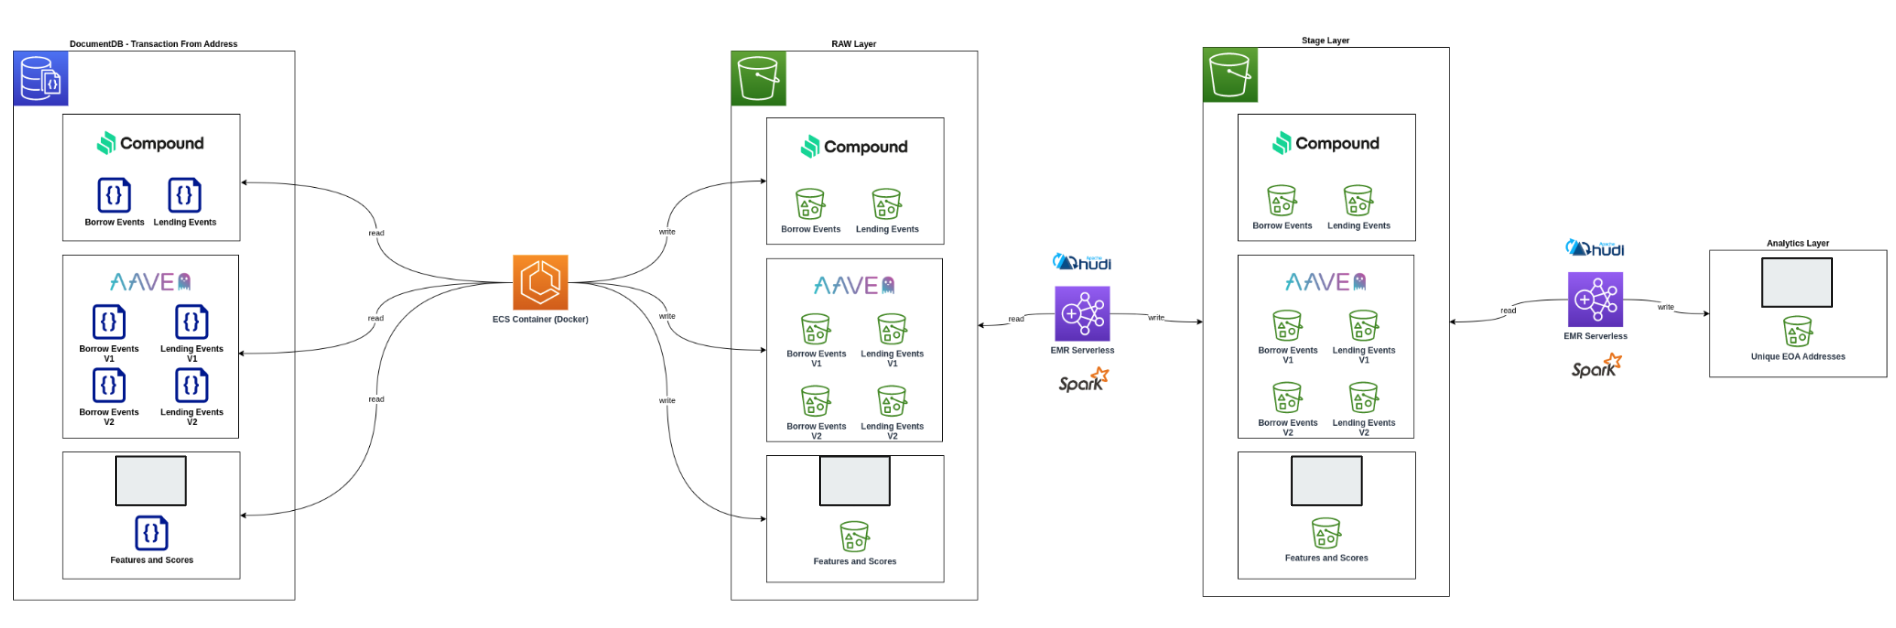
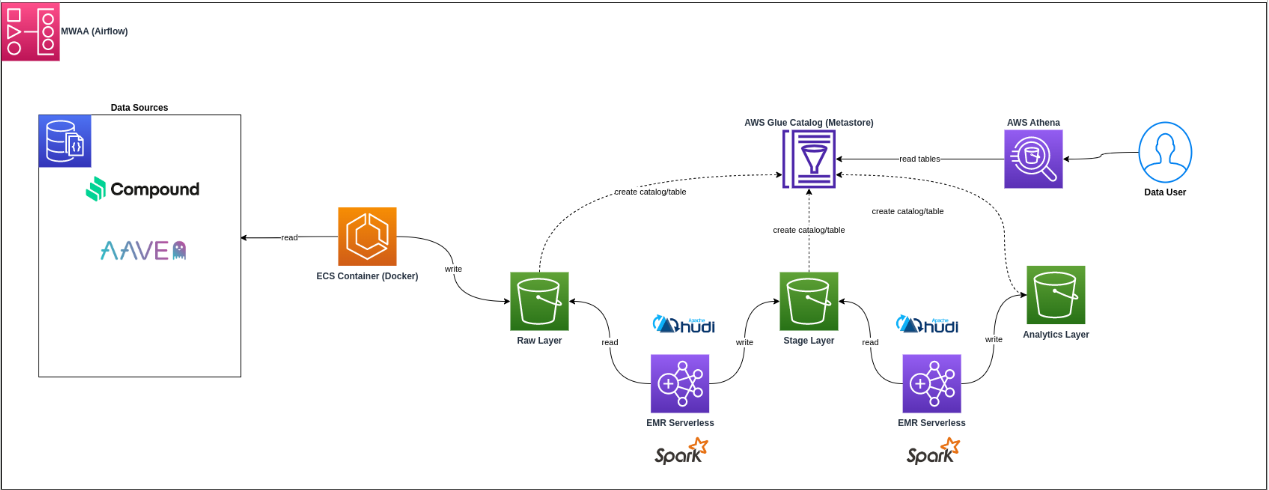
Unique EOA Address Analysis
Situation
Need to obtain unique EOA addresses from DeFi events (AAVE V1, V2, and Compound) with specific data requirements.
Task
Create data pipeline for unique EOA address tracking using Apache Hudi.
Action
- Implemented data extraction for DeFi events
- Processed unique EOA addresses
- Used Apache Hudi for upsert functionality
- Created comprehensive tracking system
Result
Successfully created tracking system for unique EOA addresses, enabling efficient DeFi event analysis.
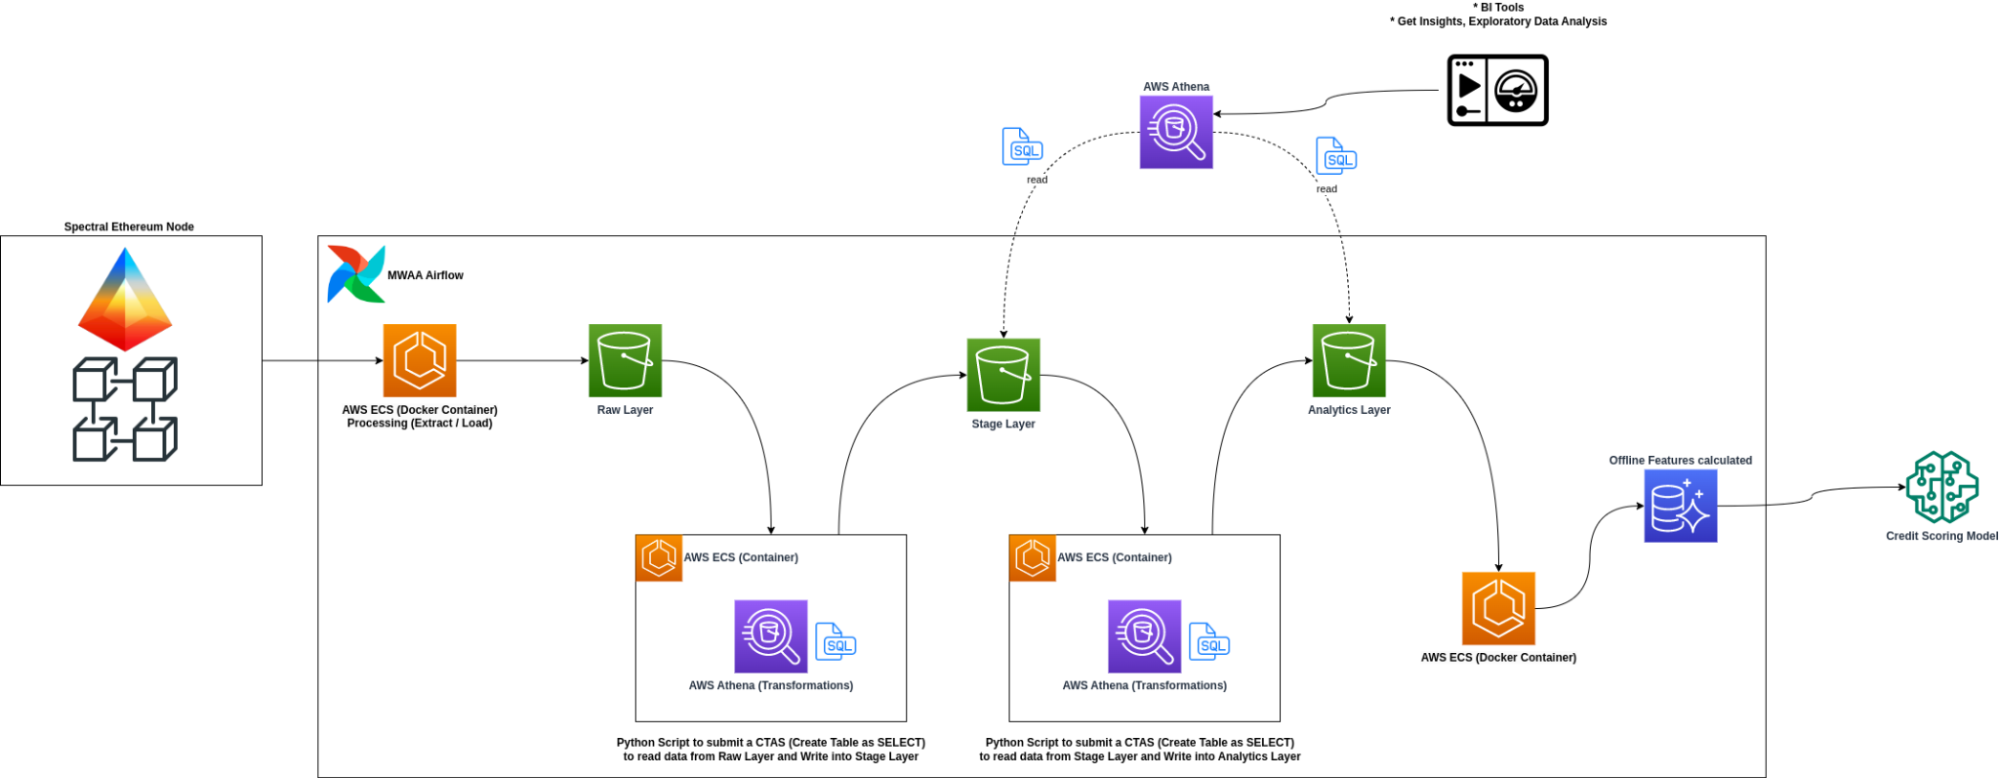
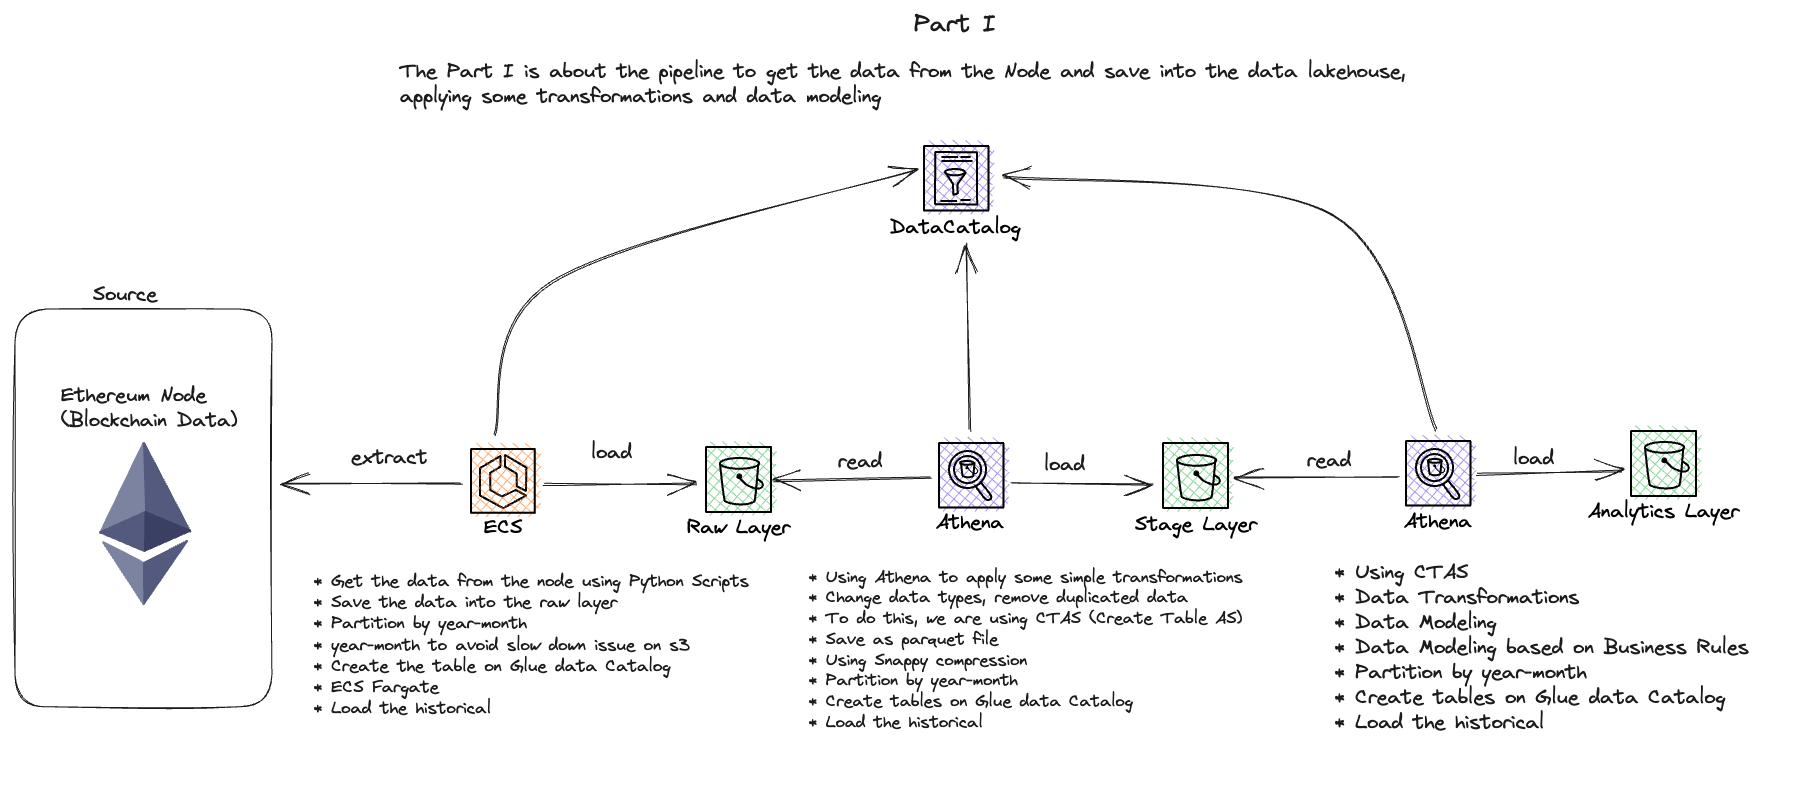
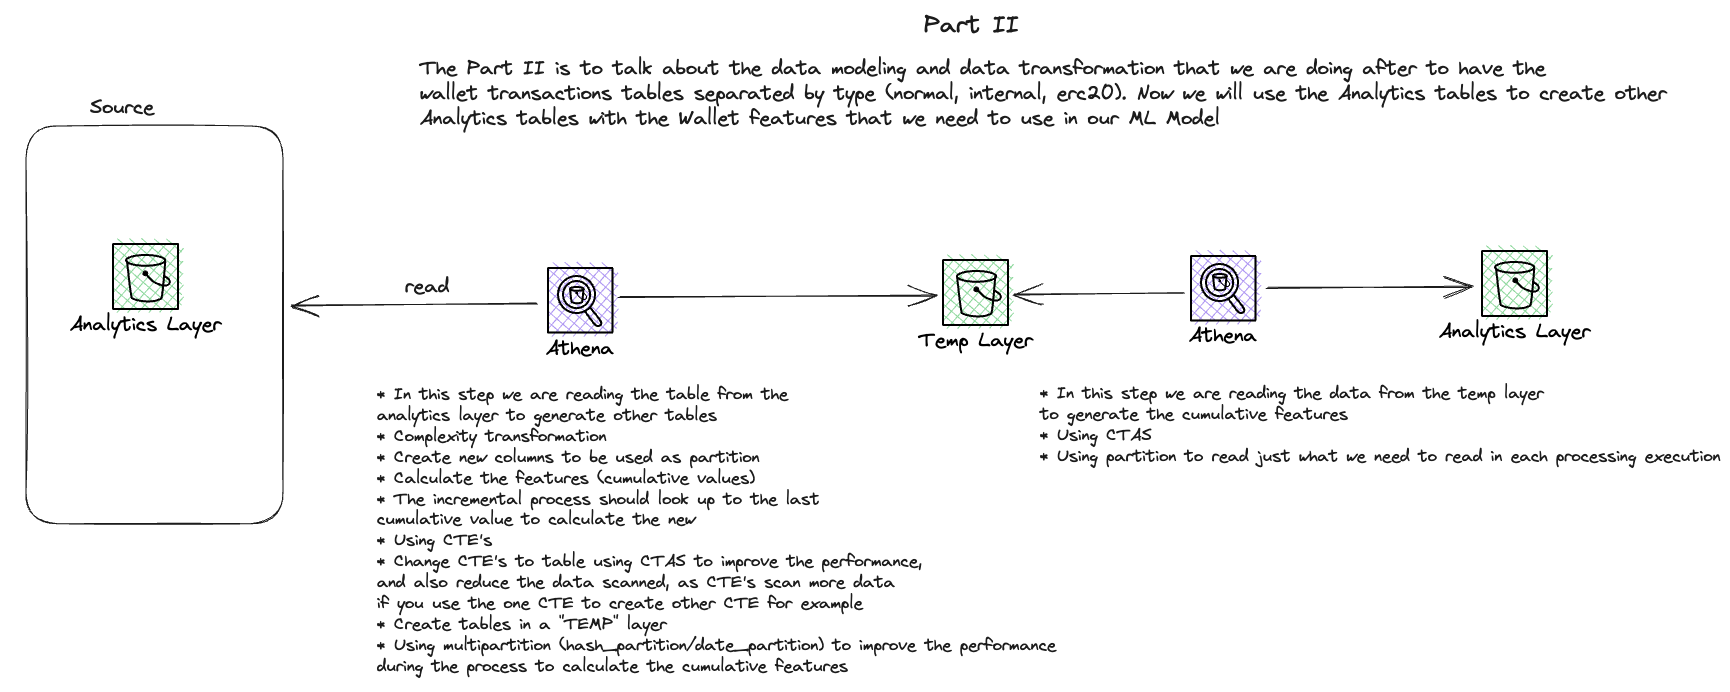
On-chain Credit Score - Data Pipeline with Ethereum Erigon Node
Situation
Organization needed comprehensive Ethereum blockchain transaction data for on-chain credit scoring, requiring faster and more reliable data access than available through Etherscan API.
Task
Design and implement a custom Ethereum node solution for on-chain credit scoring, including evaluation of different clients.
Action
- Conducted POC comparing Geth and Erigon clients for archive node capabilities
- Selected Erigon client for its superior performance in archive node operations
- Set up Python-based data extraction on AWS ECS for transaction processing
- Implemented data processing with Athena and EMR Serverless
- Created data models for transaction categorization
- Developed aggregated tables for wallet and coin balances
Result
Successfully implemented a high-performance blockchain data processing system with custom Ethereum node, enabling real-time analysis of transactions for on-chain credit scoring.
Data Ingestion Polygon Subgraph - DeFi Events
Situation
We needed to fetch data from The Graph, specifically DeFi data from the Polygon subgraph. The data of interest were events generated by lending protocols.
Task
Set up a reliable data extraction and processing pipeline to get this specific DeFi data from the Polygon subgraph on The Graph.
Action
- Configured extraction parameters for DeFi events
- Implemented data extraction from lending protocols
- Processed and transformed data for analysis
- Integrated with existing data infrastructure
Result
Successfully implemented a pipeline to fetch and process DeFi data from the Polygon subgraph, enabling detailed analysis of lending protocol events.
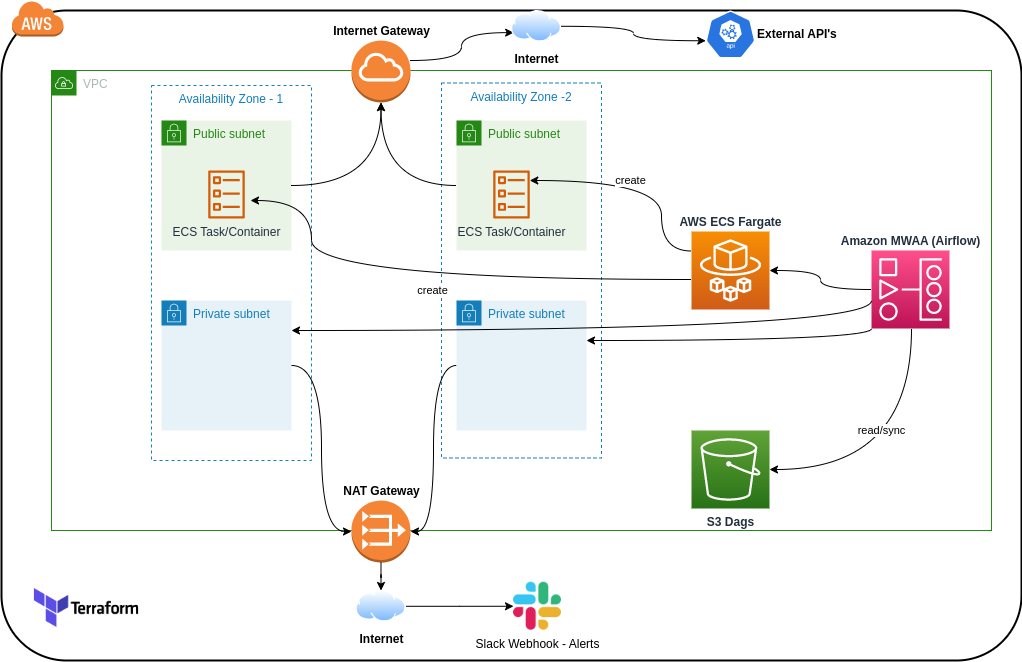
MWAA Private Network Deployment
Situation
MWAA configuration had networking issues causing high costs and security concerns.
Task
Reconfigure MWAA to operate within private network accessible only through VPN.
Action
- Assessed current MWAA setup
- Replaced NAT gateway with Internet Gateway
- Implemented private network configuration
- Enhanced security measures
Result
Reduced data traffic costs by 90% and improved security through VPN-only access.
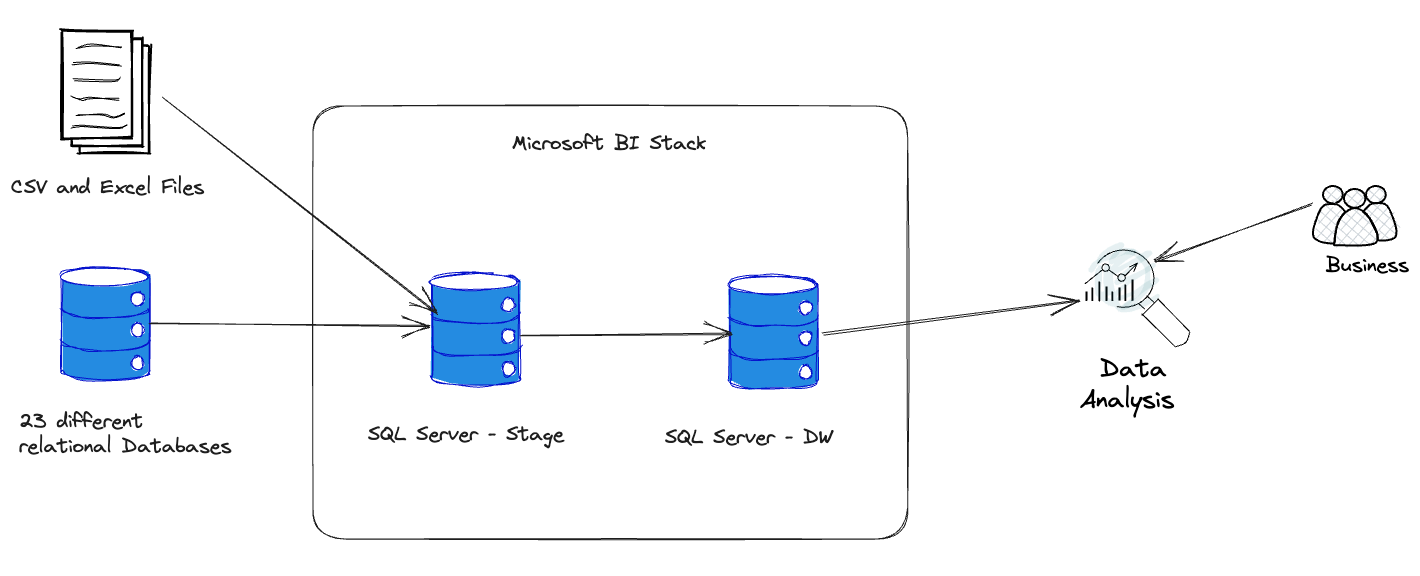
BI Platform - Retail
Situation
Working on a project that involved defining business rules with the business team and developing data infrastructure.
Task
Cooperate with business team to define rules and assist with service deployment, working with consulting company for DW data modeling.
Action
- Collaborated with business team to translate needs into concrete rules
- Assisted in deploying necessary services for project infrastructure
- Participated in DW data modeling discussions and design process
- Determined fact and dimension tables layout using schema data modeling
Result
Successfully defined business rules and established robust data infrastructure, leading to enhanced data management capabilities.
Algorithm to reduce Stockout - Retail
Situation
Company was facing a high number of product stockouts across all branches.
Task
Develop an algorithm to suggest product transfers between branches to reduce stockouts based on business rules.
Action
- Conducted exploratory analysis of stockouts across branches
- Developed algorithm for product transfer suggestions
- Created consolidated data view for visualization
- Implemented business rules into the algorithm
Result
Significantly reduced product stockouts across branches through data-driven inventory management.
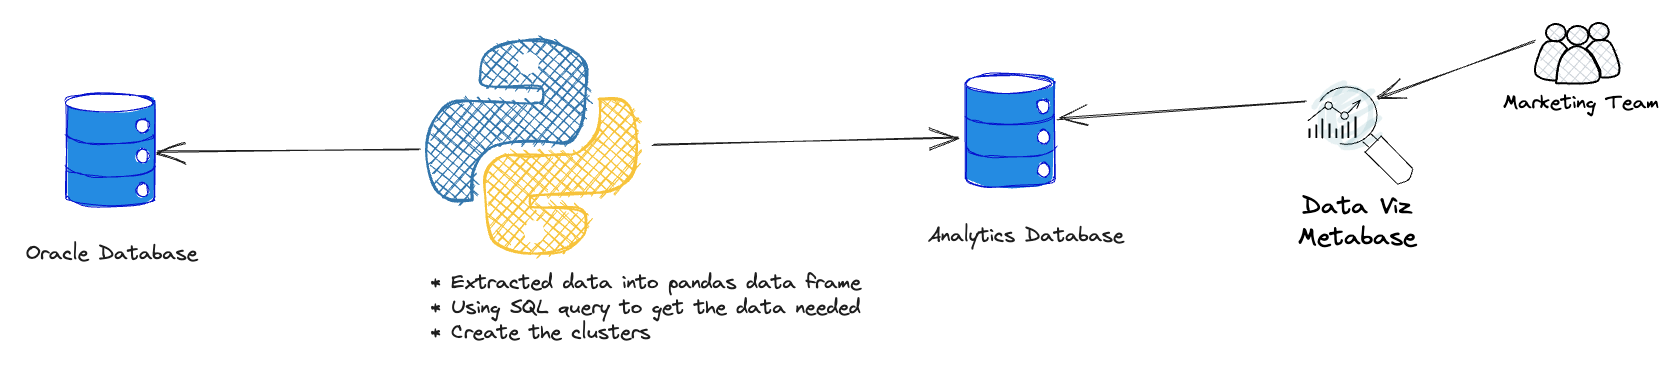
RFM Analysis
Situation
Company needed effective customer segmentation to improve marketing efficiency and sales outcomes.
Task
Implement RFM analysis and cluster analysis for customer segmentation to improve marketing targeting.
Action
- Collected and prepared customer data for RFM analysis
- Scored customers based on recency, frequency, and monetary value
- Performed cluster analysis for similar buying behaviors
- Created tailored marketing strategies for each segment
Result
Improved marketing effectiveness through targeted campaigns and increased sales through better customer understanding.
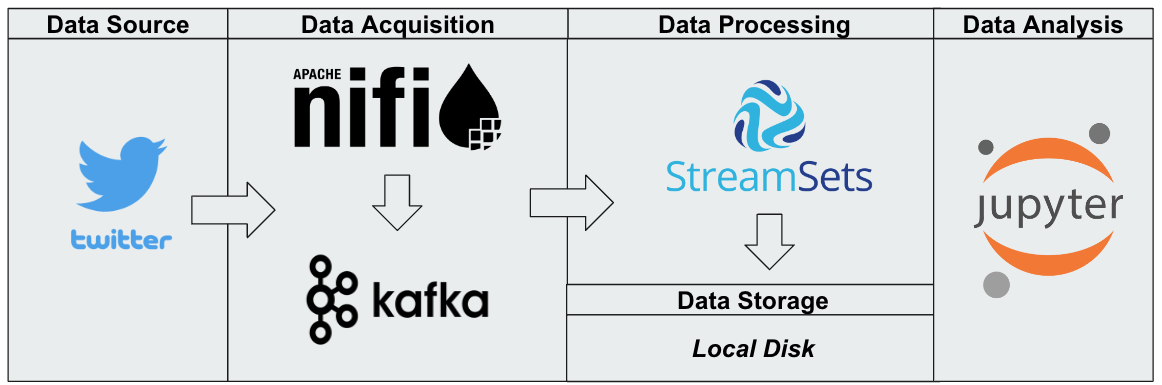
Twitter Data Analysis
Situation
Academic project requiring Twitter data collection and analysis for specific hashtags.
Task
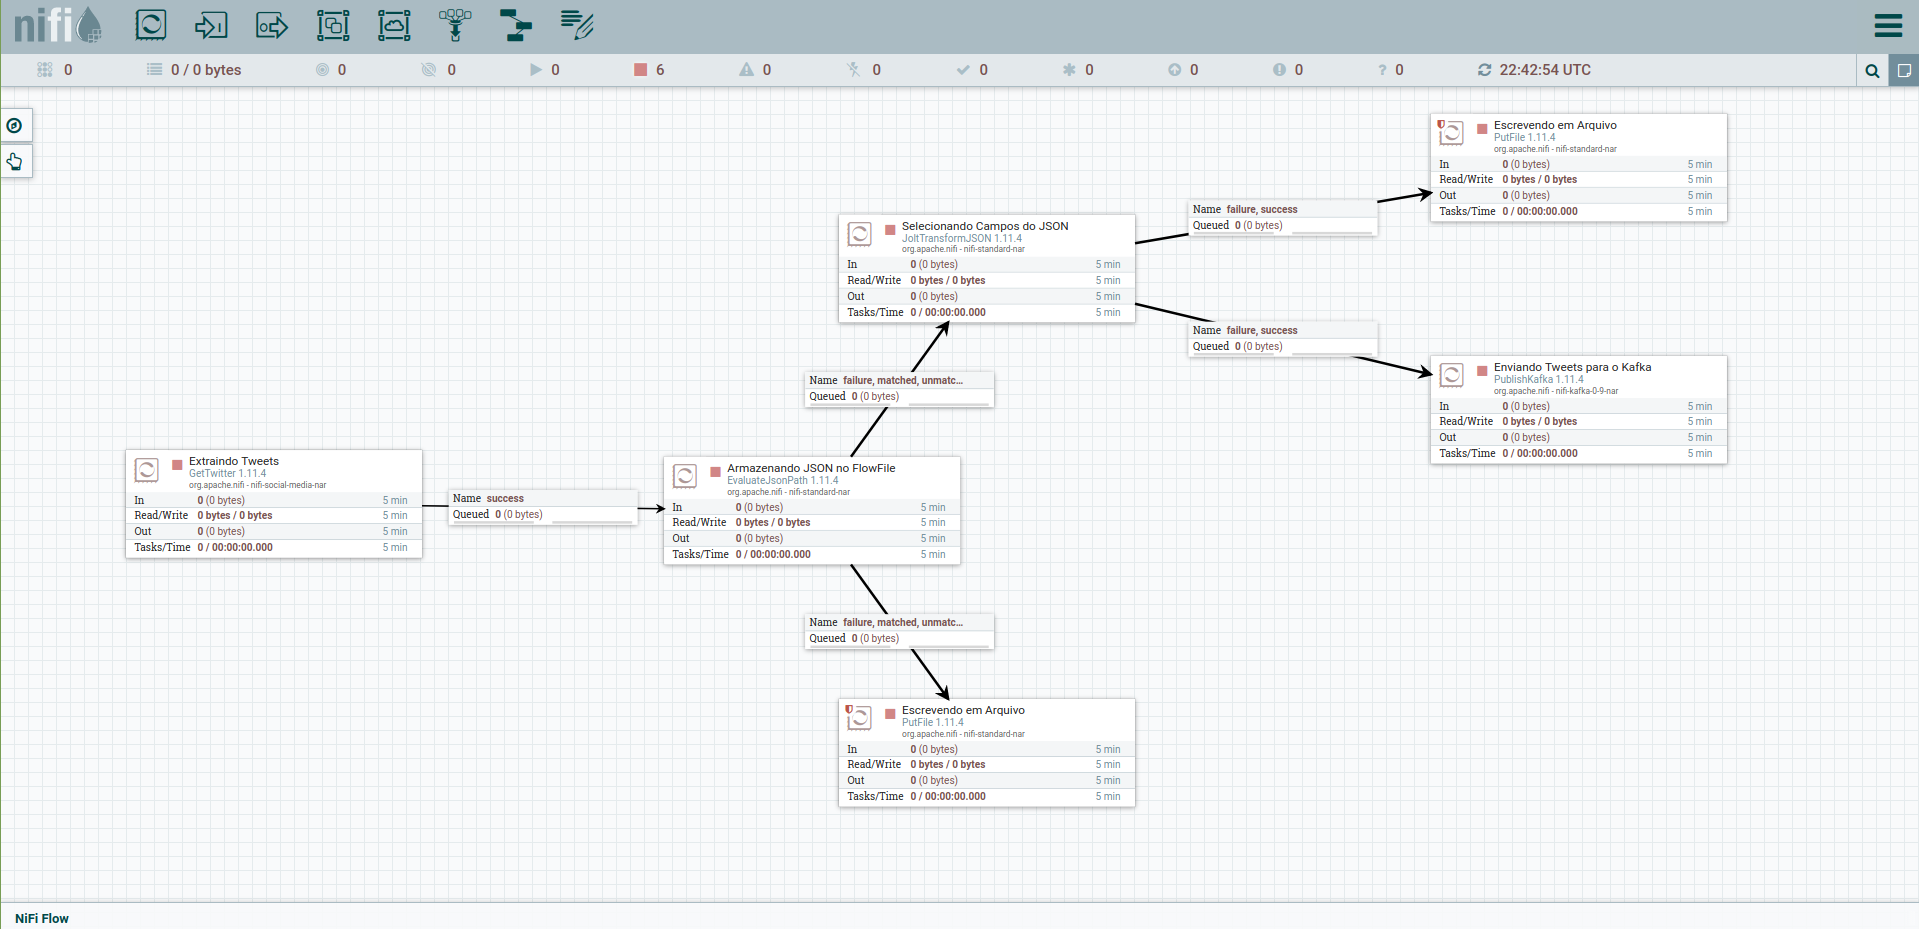
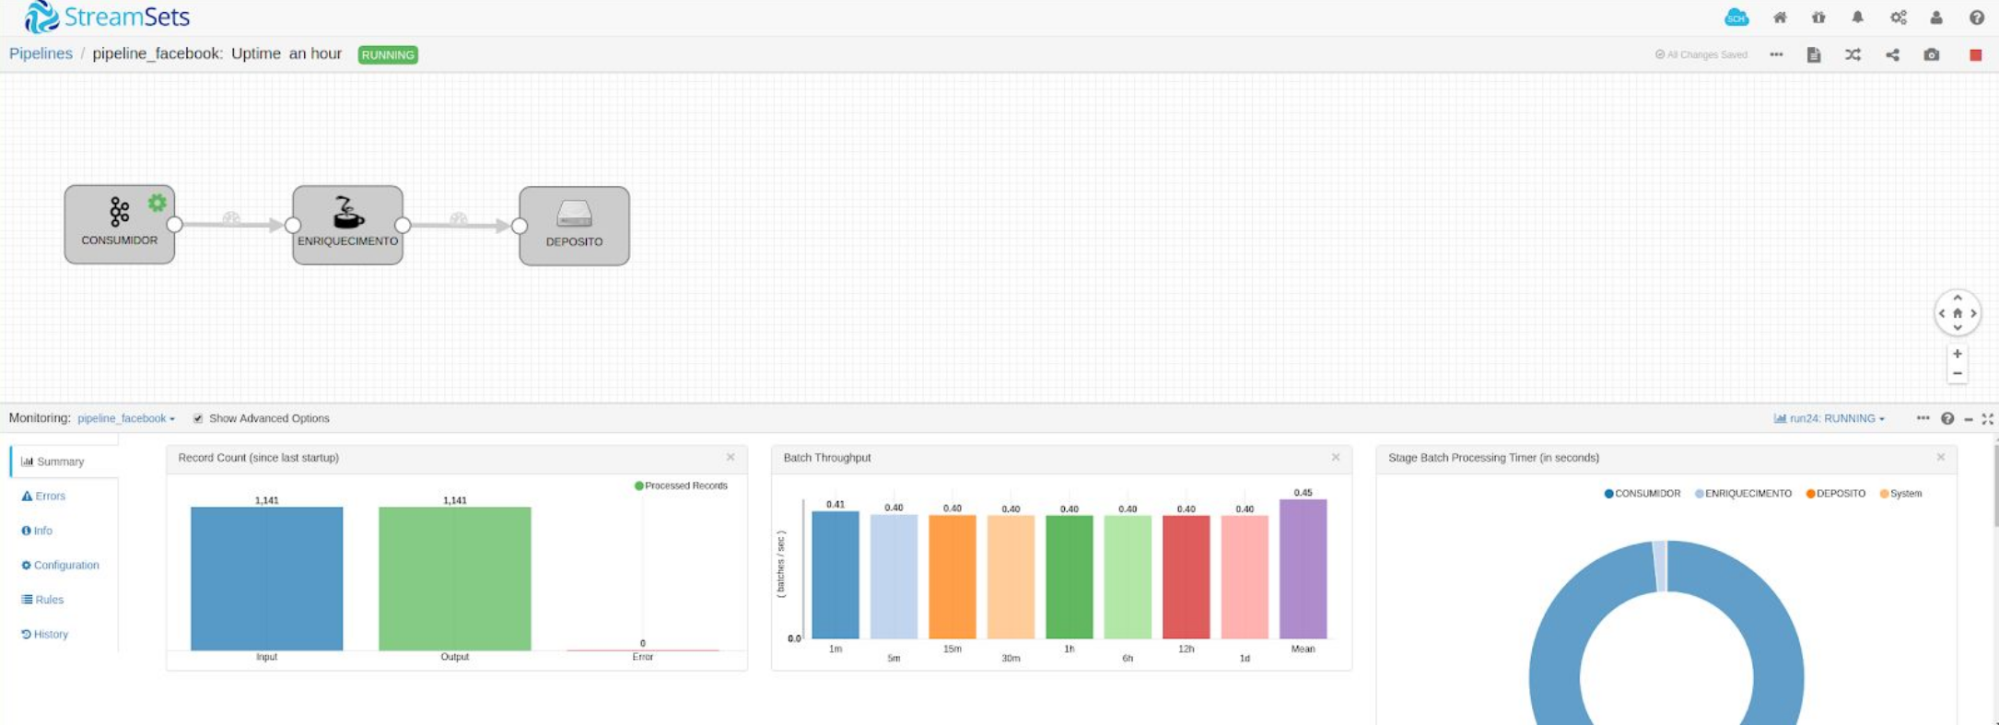
Design and implement data pipeline for tweet extraction and analysis using Apache Nifi and StreamSets.
Action
- Set up data extraction using Apache Nifi
- Implemented StreamSets for data processing
- Created data visualization
- Generated insights from collected data
Result
Successfully gathered and analyzed Twitter data, gaining practical experience with data pipeline tools.
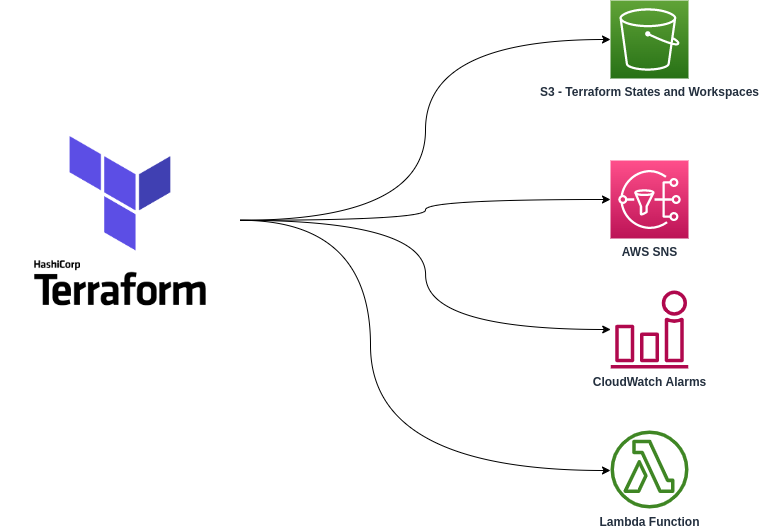
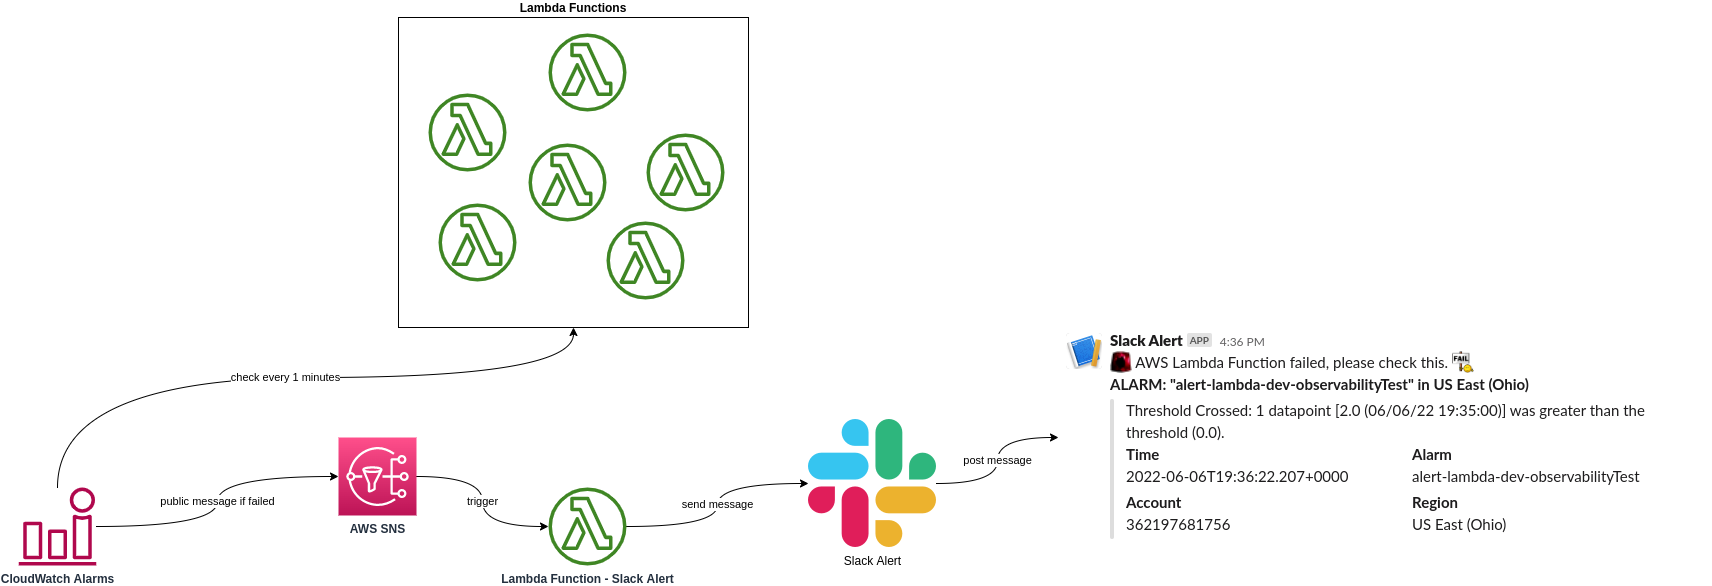
Lambda Observability Alerts
Situation
20+ AWS Lambda functions lacked failure notification system.
Task
Create observability stack for Lambda failure alerts on Slack.
Action
- Developed Python-based monitoring solution
- Implemented Slack integration
- Created detailed alert messages
- Set up automated monitoring
Result
Improved Lambda function monitoring with real-time Slack alerts, reducing downtime and improving reliability.
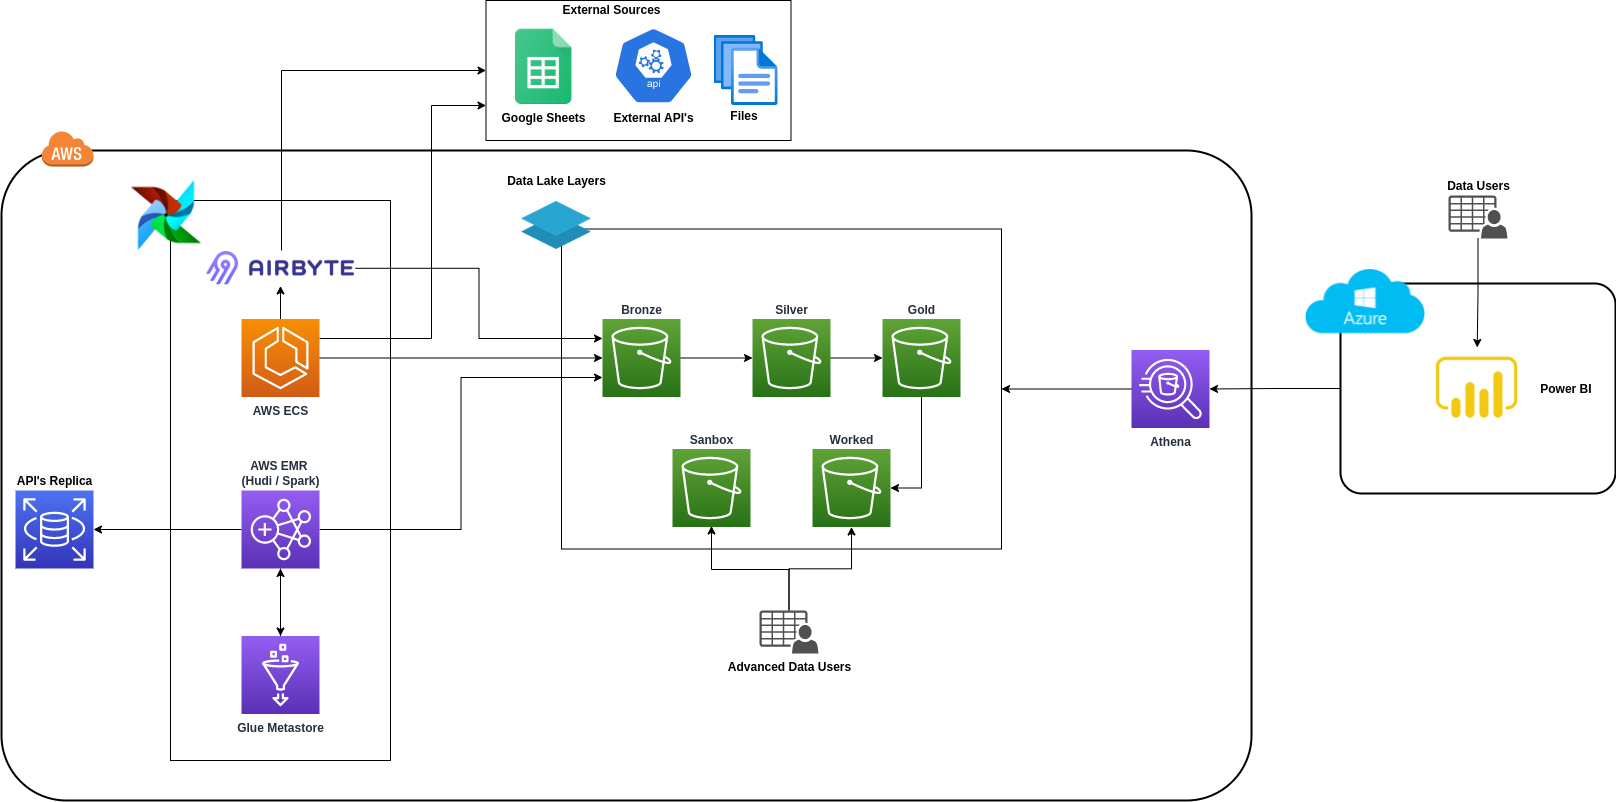
Data Lakehouse Platform - Marketplace
Situation
Company sought to become a data-driven organization, needing to construct a data lakehouse platform on AWS to handle 30+ databases, 300+ tables, and 35TB+ of data on S3.
Task
Create a comprehensive data lakehouse platform using modern data stack technologies including Spark on EMR with Hudi, Athena, ECS, Airbyte, Airflow, and Power BI.
Action
- Set up Spark on AWS EMR with Hudi as table format
- Configured Athena for interactive queries
- Implemented Python scripts on ECS for API data collection
- Integrated Airbyte for additional data extraction
- Set up Airflow for orchestration and scheduling
Result
Successfully established a scalable data lakehouse platform enabling data-driven decision making and improved data accessibility.
Data Ingestion Pipeline - From DynamoDB to Data Lakehouse
Situation
Marketplace platform needed to summarize event data from DynamoDB for business analysis, requiring a robust data pipeline solution.
Task
Design and implement a pipeline to extract data from DynamoDB and load it into the Data Lakehouse for analysis.
Action
- Leveraged AWS Kinesis Streams for real-time data capture
- Used Kinesis Analytics for data stream processing
- Stored processed data in S3 Data Lakehouse
- Implemented Athena for SQL querying capabilities
Result
Successfully implemented a real-time data pipeline enabling efficient analysis of DynamoDB event data, leading to improved business insights.
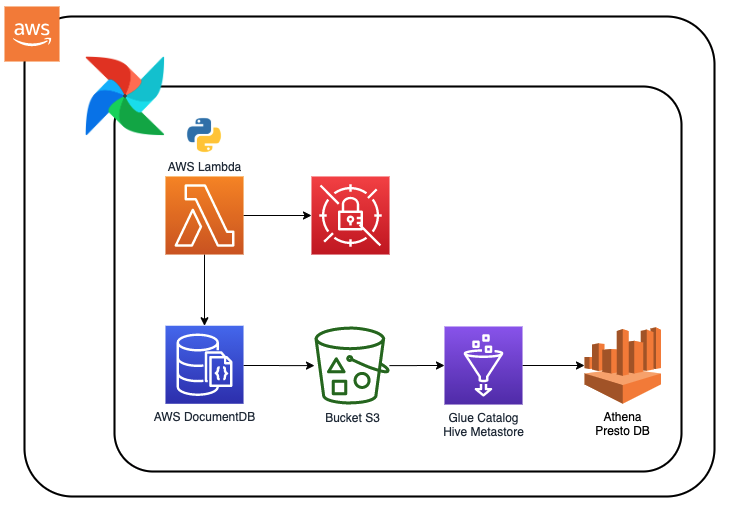
Webhook to listen to CRM Events
Situation
Sales team needed real-time insights from CRM events but lacked a system to capture and process these events for immediate analysis.
Task
Create a webhook system to listen to CRM events, process them, and store the data in the Data Lakehouse for real-time analysis.
Action
- Developed Flask application for webhook endpoint
- Implemented AWS Lambda for event processing
- Set up Serverless framework for deployment
- Integrated with S3 for data storage
Result
Successfully implemented a real-time CRM event processing system, enabling immediate access to sales data and improving decision-making capabilities.